Pet Incident Reports
Comprehensive data on pet injuries, losses, and deaths during air travel.
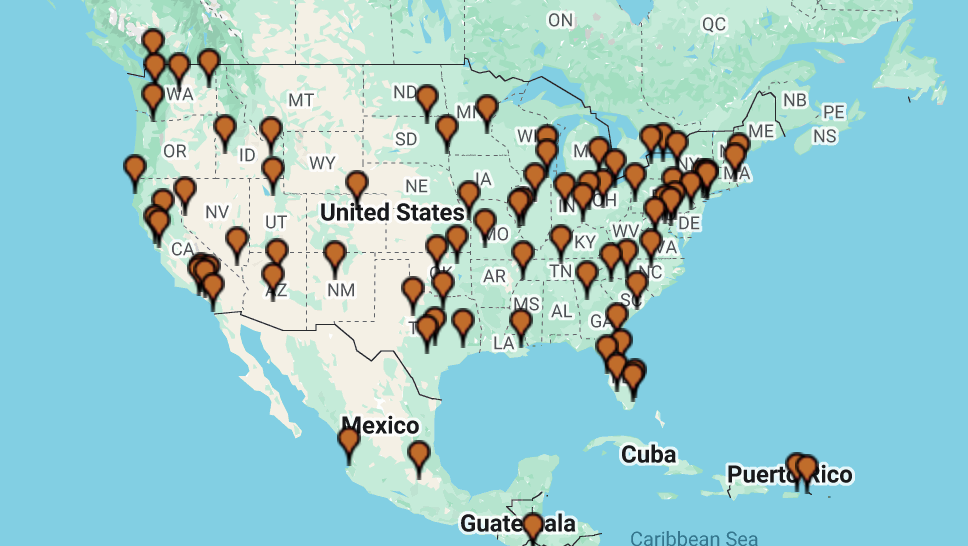
Airport Incident Map
Visualizing airports with reported pet incidents. Click the map for interactive details.
Explore Data
Incident Types
Total reported incidents since May 2005.
Historical Data
Yearly breakdown of reported pet incidents.
| Year | Losses | Injuries | Deaths | Total |
|---|---|---|---|---|
| Full Details for 2024 | 0 | 4 | 8 | 12 |
| Full Details for 2023 | 2 | 1 | 8 | 11 |
| Full Details for 2022 | 1 | 1 | 7 | 9 |
| Full Details for 2021 | 0 | 12 | 6 | 18 |
| Full Details for 2020 | 0 | 4 | 6 | 10 |
| Full Details for 2019 | 0 | 8 | 10 | 18 |
| Full Details for 2018 | 0 | 7 | 10 | 17 |
| Full Details for 2017 | 1 | 15 | 20 | 36 |
| Full Details for 2016 | 0 | 18 | 25 | 43 |
| Full Details for 2015 | 3 | 24 | 36 | 63 |
| Full Details for 2014 | 3 | 26 | 16 | 45 |
| Full Details for 2013 | 7 | 13 | 21 | 41 |
| Full Details for 2012 | 1 | 25 | 29 | 55 |
| Full Details for 2011 | 2 | 8 | 36 | 46 |
| Full Details for 2010 | 5 | 12 | 39 | 56 |
| Full Details for 2009 | 3 | 6 | 23 | 32 |
| Full Details for 2008 | 4 | 9 | 30 | 43 |
| Full Details for 2007 | 11 | 10 | 30 | 51 |
| Full Details for 2006 | 12 | 10 | 28 | 50 |
| Full Details for 2005 | 7 | 16 | 21 | 44 |

